Falcon / Large Segment
As there is no longer any manufacturing of the Falcon / Ute and Territory these models are now just fading away with some residual sales of dealer stock. Falcon can now be considered completely gone (despite the 2 sales in February) and it has been removed from some of the charts and graphs.
Mustangs sold 492 in February and this is down 19.7% on the year to date numbers for last year.
The Commodore also is now in run out of residual stocks to register 737 sales (829 less than in 2017) while the Aurion sold 26 150 less than in 2017.
For the year to date all three models are obviously down with the total passenger market up by 5.86% or 9,733 units.
The top sellers for this month see the top passenger vehicles juggled around a fair bit. The Mazda 3 (2,935) dropped one place and lost the segment lead to the Toyota Corolla (3,270 and up one) with the Mazda CX-5 (2,191) steady in 3<sup>rd</sup>. The Hyundai i30 (2,182) and the Toyota RAV 4 (1,780) remained steady in 4<sup>th</sup> and 5<sup>th </sup>places respectively; Hyundai Accent (1,782) up ten places in 6<sup>th</sup>; VW Golf (1,649) up a place to 7<sup>th</sup>; Nissan X-Trail (1,622) down two spots to 8<sup>th</sup>; Mitsubishi Outlander (1,611) up twelve places to 9<sup>th</sup> and the Top 10 rounded out by the Hyundai Tuscon (1,604) which gained one spot.
Worth noting: Toyota Camry (1,381) gained eighteen places to 14<sup>th</sup> place while the Holden Commodore dropped another nine places to 35<sup>th</sup> and the Hyundai Kona (910) dropped nine places to 26<sup>th</sup>.
If we were to include the 4x4 Utes in the listing, then the Toyota Hilux comes in at 2<sup>nd</sup> overall; the Ford Ranger is 3<sup>rd</sup>, the Mitsubishi Triton is 8<sup>th</sup>and the Nissan Navara takes 14<sup>th</sup> place.
No Ford models made it inside the Top 25 and seventeen of the Top 25 come from the one of the SUV categories.
The Large segment lost market share to 1.10% of the market in February and it (naturally) dropped 48.2% (1,976 units) in volume compared to 2017.
The top selling passenger vehicle sales are shown below:
.. and the same chart with the 4x4 Utes included.:
The chart below looks at the large segment slide in comparison to the Light (Fiesta), Small (Focus) and Medium (Mondeo) segments during the last ten years from a dominant position to almost at the bottom.
Ute 4x2
The Falcon Ute is gone now and wont be included in future charts except where historically appropriate. Ranger sales were steady with 442 sold during the month, 8 more than the same time last year.
The Ford Ranger (down 3.0%) remained in 2<sup>nd</sup> place this month behind the Toyota Hilux (1,169) and in front of the Mazda BT-50 (435), Isuzu Ute D-Max (371) and Nissan Navara (319).
For 2018 YTD the segment is up 6.58% (372 units) and it held a much smaller 3.59% of the market.
4x4 Utes
The 4x4 Utes are the more dominant of the utes and they held a slightly improved 14.79% of the total market during the month and their segment sales are up 21.88% (4,606) for the year thus far.
Most of the major contenders made gains compared to the same period last year Navara (+60.6%), Triton (+8.1%), Hilux (+41.3%) and Ranger (+27.0%) with only the Colorado (-11.0%) taking a hit.
The Toyota Hilux (3,257) regained the segment from the Ford Ranger (3,098) with the Mitsubishi Triton (1,634) up a place in 3<sup>rd</sup> ahead of the Nissan Navara (1,460) down one to 4<sup>th</sup> and the Holden Colorado (897) steady in 5<sup>th</sup> place
Prestige Segment
The Caprice, also in stock run-out mode managed 3 sales and the luxury segment is down 7.86% overall. Chryslers 300/C managed 24 sold in February to be up 15.9% on this time last year.
With no Ford entrant in the category we no longer graph this category.
Fiesta / Light Segment
The Hyundai Accent (1,782) retained the segment lead and with a more normal gap to the Mazda 2 (959) in 2<sup>nd</sup> with the Honda Jazz (846) up four places to 3<sup>rd</sup>.
The rest of the top group consists of:
Toyota Yaris (797) down one to 4<sup>th</sup>;<sup>
</sup>Suzuki Swift (634) down one to 5<sup>th</sup>;
Kia Rio (561) down one to 6<sup>th</sup>;
VW Polo (498) down one to 7<sup>th</sup>;
Ford Fiesta (68) gained a place to 11<sup>th</sup>.
This segment held a higher 7.86% of the total market in January and is now up compared to 2017 by 2.51% (334 units). Its also mostly downward results for about half the contenders in the segment with the Toyota Yaris down 20.7%, Mazda 2 down 7.3%, Fiesta down 52.5% and VW Polo down 17.4%. Barina +63.6%, Suzuki Swift +71.3% and Kia Rio +33.7% are the biggest winners.
Please note we have shortened the time scale on some of the segment graphs as they were getting too difficult to read over the longer term.
Focus / Small Segment
The month saw Focus remain in 10<sup>th</sup> place with a reasonable 516 sold. The segment lead was regained by the Toyota Corolla (3,270) ahead of the Mazda 3 (2,935 and down one) with the Hyundai i30 (2,182) in 3<sup>rd</sup>. The remainder of the Top ten are:
VW Golf (1,649) steady in 4<sup>th</sup>;
Kia Cerato (1,491) steady in 5<sup>th</sup>;
Honda Civic (1,409) steady in 6<sup>th</sup>;<sup>
</sup>Holden Astra (1,008) up one place in 7<sup>th</sup>;
Mitsubishi Lancer (938) up one place in 8<sup>th</sup>;
Subaru Impreza (824) down two places in 9<sup>th</sup>;
Ford Focus in 10<sup>th</sup>.
For the year to date, Corolla is down 4.6%, the Mazda 3 is down 7.3%, the Focus down by 10.0% and the Subaru Imprezza down 6.2%. On the winning side, Honda Civic is up 58.7%; VW Golf up 24.0% and Holden Astra up 135%.
The segment held a slightly larger market share of 20.33% in February and it is up 2.59% (899 units) compared to 2017.
Mondeo / Medium Segment
In February, 196 Ford Mondeos were sold and it gained two spots to be in 3<sup>rd</sup> place. The segment lead was held by the Toyota Camry which sold 1,381 with the Mazda 6 (233) still in 2<sup>nd</sup> and the Skoda Ocatvia (150) down one place to 4<sup>th</sup>. The Volkswagen Passat (143) gained a place to 5<sup>th</sup> while the Subaru Liberty (140) dropped one to 6<sup>th</sup>. If they were counted on size and not price the Mercedes C Class (495) and CLA-Class (292) would have been in the top five.
Percentage wise, the Hyundai Sonata (+19.7%) is the only winner compared to 2017 with the Subaru Liberty (-31.9%), Mondeo (-39.7%) and Honda Accord (-41%) the biggest losers.
The segment held an improved 2.76% of the market in February and has lost volume by 13.19% compared with 2017 a drop of 664 sales and it really is rapidly becoming as irrelevant a segment to contend in as the large segment has been for some years.
Ecosport / Light SUV Segment
During February, the Ford Ecosport sold an improved but hardly earth shattering 68 units and it gained one place into 13<sup>th</sup> place with the rest of the order being:
Mazda CX-3 (1,562) retained the segment lead;
Honda HR-V (1,067) up two places in 2<sup>nd</sup>;
Subaru XV (1,045) down a place in 3<sup>rd</sup>;
Hyundai Kona (910) down a place to 4<sup>th</sup>;
Mitsubishi ASX (902) up one place to 5<sup>th</sup>;
Nissan Quashqai (866) down a place to 6<sup>th</sup>; and
Toyota CH-R (725) steady in 7<sup>th</sup>.
Please note that we have realigned our stats with the VFACTs categories now that there is a Ford entrant in this segment.
Mostly losers in this segment, the Nissan Juke is down 58.5%, Mitsubishi ASX down 19.9%, Holden Trax down 33.3% and the Ecosport down by 66%. On the other side, Subaru XV is up 91.5%, Mazda CX-3 up 6.4% and the Nissan Qashqai up 5.4%.
The segment held a smaller 9.82% of the market in February and it is up 24.23% (3,556) compared to 2017.
Escape / Compact SUV Segment
During December, the Escape sold 471 units and remained in 10<sup>th</sup> place with the top positions held by:
Mazda CX-5 (2,191) retained the segment lead;
Toyota RAV-4 (1,841) steady in 2<sup>nd</sup>;
Nissan X-Trail (1,622) steady in 3<sup>rd</sup>;
Mitsubishi Outlander (1,611) up three places in 4<sup>th</sup>;
Hyundai Tucson (1,604) steady in 5<sup>th</sup>;
Honda CR-V (1,381) down two places in 6<sup>th</sup>; and
Kia Sportage (1,1102) down one place in 7<sup>th</sup>.
Most contenders are now up in volume for the YTD with only the Hyundai Tuscon down 7.6% and Subaru Forester down 15.5%. Honda CR-V is up 167%, Escape up 158.1%, Mitsubishi Outlander up 66.5%, Toyota RAV4 up 16.1% and Kia Sportage up 5.0%.
The segment held a smaller 15.84% of the market in February and it is up 20.0% (4,695 units) compared to 2017.
Territory / Medium SUV Segment
Territory is pretty much done with no sales last month. The segment lead was regained by the Toyota Kluger (1,420) ahead of the Toyota Prado (1,323) which dropped a place to 2<sup>nd</sup> with the Subaru Outback (821) steady in 3<sup>rd</sup>. The rest of the Top 10 being:
Mitsubishi Pajero Sport (766) up three places to 4<sup>th</sup>;
Mazda CX-9 (707) down one place to 5<sup>th</sup>;
Isuzu Ute MU-X (600) up one place to 6<sup>th</sup>;
Hyundai Santa Fe (555) up two places to 7<sup>th</sup>; and
Holden Captiva (515) down three places to 8<sup>th</sup>.
The Ford Everest is starting to have some impact on the sales chart with 475 sold, good enough for 9<sup>th</sup> place a one place drop.
Jeep (+10.9%), Kluger (+80.2%) and Everest (+67.4%) are all better than last year with only the Captiva (-42.2%) showing any substantial drop. Despite the mixed individual performances, the segment still held an improved 10.36% of the market in February but has dropped volume by 3.52% for the year to date a decrease of 649 sales.
The second chart depicts sales for the Territory and Everest over the entire production life.
Market Share Analysis
The Falcon v Commodore and Ute market charts have now been dropped with no sales on the Falcon platform.
The newer chart to show the combined Holden and Ford sales for 4x2 Utes using the same percentage share as the previous two continues. This looks at the period from January 2012 when they both had two entries in the market place and as the Ranger continues, this chart will remain.
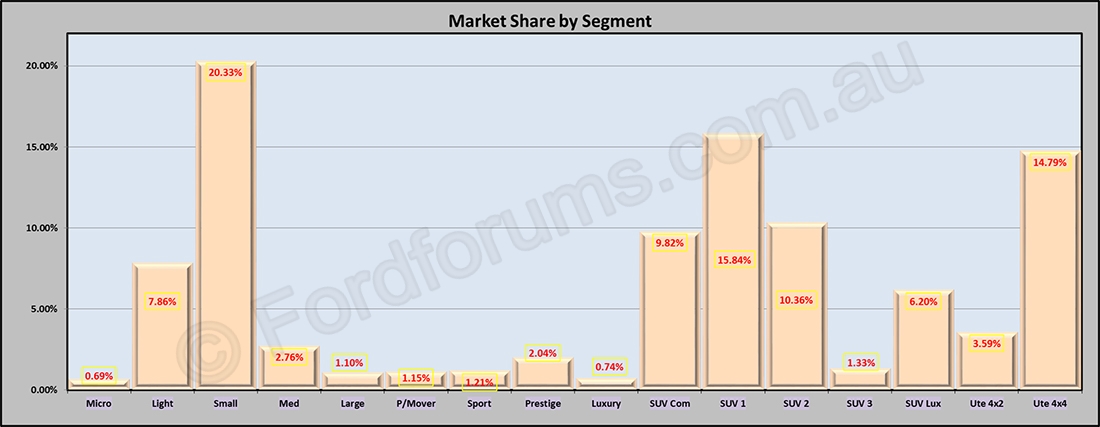
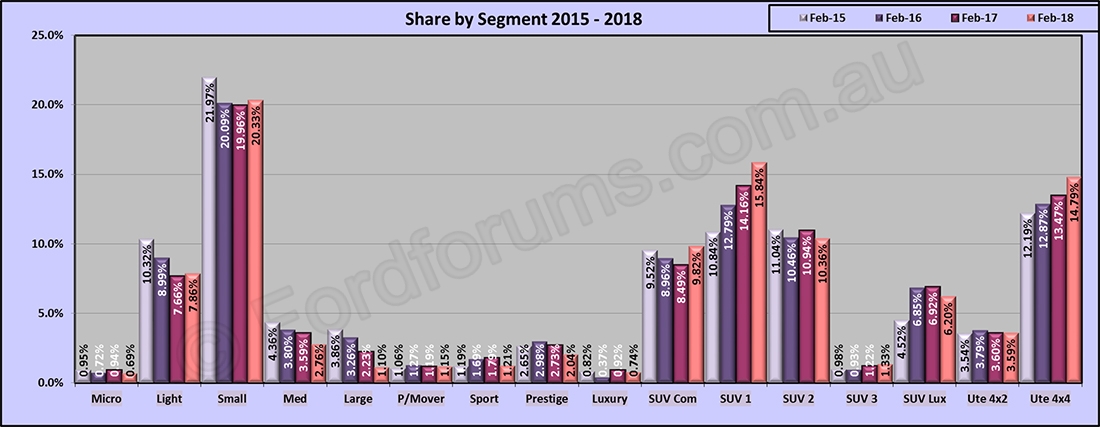
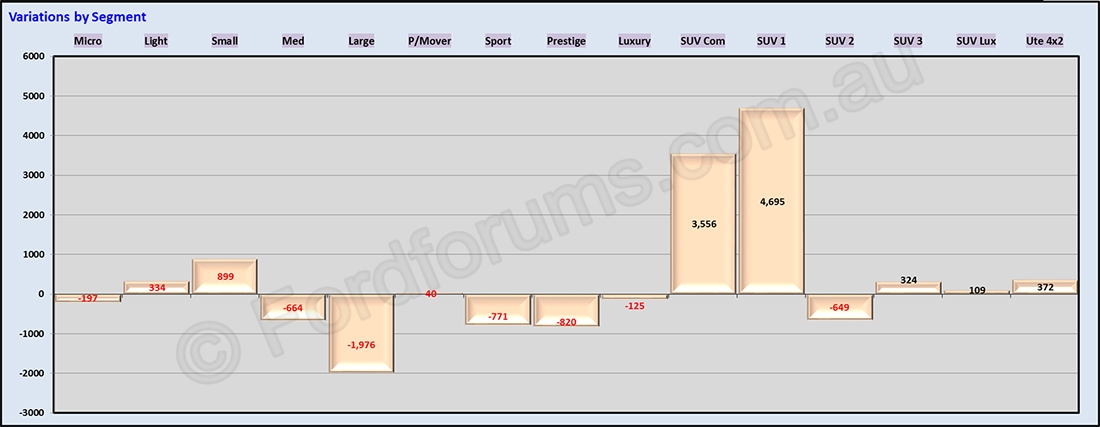
For an easy look at the share held by each market segment, we have included a set of graphs that display this for quick reference the first looks at the percentage market share for the current month while the second compares the actual raw numbers for the current month in 2007- 2015 where it is easy to see quickly which segments have gained and which have lost. We have also added a look at the segment movements in raw numbers terms for the month YTD. This shows the actual unit numbers that have been gained or lost within each segment for the year to date.
Total Market
Toyota retained the passenger market leadership in February with 18,049 passenger segment sales giving them a comfortable lead over Mazda (9,913); Hyundai (8,001) in 3<sup>rd</sup>; Mitsubishi (7,142) up two places to 4<sup>th</sup>; Ford (5,961) steady in 5<sup>th</sup>; Nissan (4,863) up a place to 6<sup>th</sup>; Holden (4,689) down two places to 7<sup>th</sup>; VW (4,671) steady in 8<sup>th</sup> and Kia (4,664) in 9<sup>th</sup>.
In percentage terms VW is down 0.4% on 2017 while Holden are down 19.4%. On the positive side, Mitsubishi is up 14.5%, Kia is up 12.3%, Toyota is up 16.2% and even Ford is up by 0.5%.
We have been taking a look at the 15+-year history of the four manufacturers (Ford, Holden, Mazda and Toyota) from 2000 to the current time. These figures are based on year to date sales and as well as making the recent gain in the overall market apparent they also clearly depict how Toyota has pulled away from everyone since 2003; Mazdas gain (and overtaking) of Ford in the 3<sup>rd</sup> to 5<sup>th</sup> place battle and the increasing penetration of both Nissan and Hyundai.
The next set of charts look at the trends within each segment and draws some comparisons between various battles within them. Please note that these graphs are based on the percentage share of the total market and as the market has been growing each year for the last decade or so (with the exception of 2009) the actual gains or losses are significantly greater than the gradual changes shown in the graph.
First up is a look at the four passenger segments where we can clearly see the continued slide in the large car segment, the strength of the dominant small segment and the rise in the light segment.
Second is the percentage share held by each segment during the last five years worth noting is the impact of the SUV realignment and the continued, if somewhat inconsistent, strength of the small segment.
Third is a closer look at the sport, prestige and luxury segments over the same time frame. While some of the vehicles that get placed in these categories defy logic they are the segments that are a good indicator of the general economic performance in Australia and they had all trended slightly downward but appear to have rallied so far this year.
Fourth is a look at the SUV segments. These segments had been growing quite rapidly and most of that growth had been in the compact and medium sized vehicles but after the realignment this year the medium segment now has the upper hand over the compact segment most of the time although it is inconsistent. We have included the new segment for completeness.
To see who the winners and the losers are so far this year here is a comparison of the various manufacturers on a YTD basis when compared to last year. For the purpose of the exercise we have obviously picked the (modern) big four; Toyota, Holden, Mazda and Ford but also added a couple of others that have been big movers in recent times by way of comparison. The first chart looks at the raw numbers while the second looks at the percentage variation.
Drilling down on the winners and losers a bit more shows some interesting changes amongst both manufacturers and individual models.
The biggest overall improver is Honda, gaining 2,877 sales which is a 43.2% improvement on 2017 although Toyota actually gained more sales (4,634) but that only represented a 16.2% increase. Others in the better than 10% improvement club include Ferrari (+65.4%) although off a very low numerical base; Isuzuz Ute (+38.3%); Mitsubsishi (+14.5%) and Kia (+12.3%).
The biggest overall loser is Holden, down 19.4% and 2,500 sales although Land Rover dropped 18.8% (445) and both Jaguar and Infiniti lost almost half their sales volume compared to last year.
In terms of individual models, the Toyota Hilux 4x4 has gained the most sales (1,793) ahead of the Honda CR-V (1,749) and Ford Ranger 4x4 (1,272). Also in the +1,000 club (excluding new entrants) are the Nissan Navara 4x4 (1,050), Toyota Kluger (1,031), Subaru XV (1,029), Mitsubishi Outlander (1,023) and Holden Astra (1,005). The Honda CR-V also recorded the highest percentage gain (158.1%) with the Audi A5, Mercedes Benz E-Class Coupe and Holden Astra all more than doubling their sales.
On the less happy side, the Holden Commodore dropped 1,918 sales to suffer the biggest numerical loss and record the only >1,000 unit loss. Next closest is another Holden (Capitva) which dropped 884 units. The Holden Caprice topped the losing percentage chart with an 89.4% drop with the Fiat 500X, Toyota Aurion, Mitsubishi Mirage, Audi Q3, Holden Commodore, Nissan Pathfinder, Toyota Prius C, Ford Fiesta, Hyundai iMax and Land Rover Evoque all more than halving their sales volumes compared to 2017.
Next up is a look at some individual models naturally all of the current Ford range with any real volume has been included but also the segment leaders and the red corner competition along with anything else that seemed of interest.
.. and a (newer) comparison of all the non-Falcon based Ford models.
Please note that the Mustang is now included.
Finally, a little look at the origin of our vehicles - not really a concern now that we know the future of our automotive industry but it does at least show where some of the production off shore originates.
The pie chart shows the major origins for vehicles sold in the Australian market on a YTD basis (along with a comparison from 2009) while the second chart compares those figures to the previous years and the final chart shows a YTD total (by year) for all imports compared to locally produced. Far from a pretty picture when in the space of the seven years covered, locally manufactured sales have dropped by 88.1% and they have dropped by 67.7% this year.


 Ford Australia Sales Stats February (02) 2018


Be The First